
Sanborn Maps
If you've ever wondered what your block looked like 100 years ago, Sanborn Fire Insurance Maps are the perfect place to start. Originally created for assessing fire insurance liability in urban areas, these maps have become invaluable tools for historians, genealogists, preservationists, and anyone interested in the built environment of the past.
What are Sanborn Maps?
First produced in the 1860s by the Sanborn Map Company, these highly detailed, color-coded maps documented the structure and use of buildings in towns and cities across the United States. They include everything from construction material to the number of stories, location of doors and windows, and property boundaries. While their original purpose was to help insurance companies assess risk, today they serve a different function: helping us trace the evolution of our communities.
While the Sanborn Map Company is the most famous producer of fire insurance maps, it wasn’t the only one. In fact, Sanborn’s origins trace back to Daniel Alfred Sanborn, who was originally contracted by Aetna Insurance to produce maps under his own name in the 1860s. These early maps, sometimes referred to as Whipple or D.A. Sanborn maps, laid the groundwork for what would become the Sanborn Map Company in 1867. Around the same time, other firms like Perris & Browne, Hopkins, and Hexamer were also producing detailed fire insurance maps for specific cities or regions, particularly in the Northeast and Mid-Atlantic. Some of these companies were eventually absorbed by Sanborn or phased out as Sanborn became the dominant player. Today, Sanborn maps are the best known because they were produced for so many communities across the United States and because their records have been well preserved and digitized by institutions like the Library of Congress.
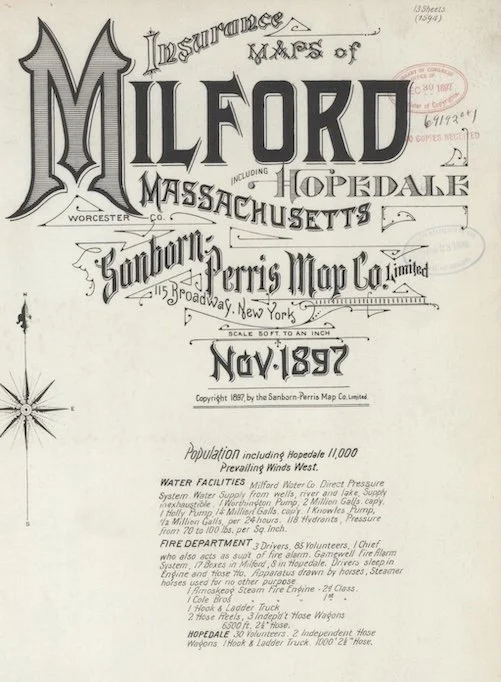
Milford, MA Sanborn Map title page.
Where to Find Sanborn Maps
Many libraries, especially those in major cities or with dedicated map divisions, offer access to Sanborn maps. The Library of Congress Geography and Map Division is a standout resource, offering a large digital collection online. Local libraries, historical societies, and town archives are also worth checking.

Library of Congress.
How to Use Them
Using Sanborn maps requires a bit of orientation. Start with the introductory material in each volume, which includes title pages, indexes by street or block, and often a graphic index that shows how each sheet fits into the city grid.
Once you've found your location:
Use the key to interpret abbreviations (like “D” for dwelling or “Sal” for saloon), color codes (yellow for frame buildings, red for brick, blue for stone), and line styles (solid for walls, breaks for doors and windows).
Zoom in on changes by comparing different years. You can see how buildings evolved—or disappeared—over time.
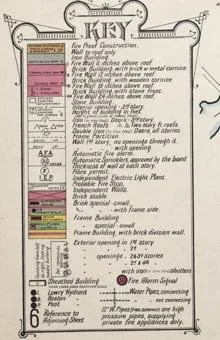
Sanborn Map key.
Watch Backlog’s Webinar on Sanborn Maps to Explore These Records in Action
Check out our webinar on Sanborn Maps, where we walk through case studies that show how buildings and neighborhoods have changed over time.